There’s a parasite in modern marketing—and most of us have caught it. Rory Sutherland calls it technoplasmosis: the creeping infection in which ad platforms quietly rewire our priorities so we end up optimising for their dashboards instead of our brands.
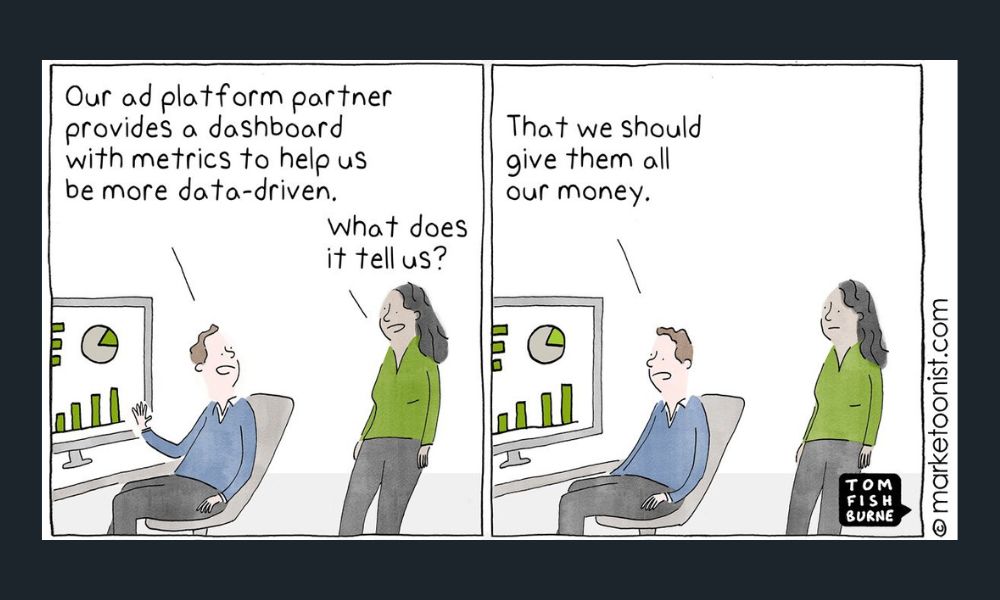
Tom Fishburne summed it up perfectly: “Many of the metrics marketers chase are not designed to serve the brand. They’re designed to serve the platforms that provide those metrics.” And in classic Tom Fishburne fashion (the Marketoonist), he created the cartoon above about this.
Adel Borky’s write‑up in The Drum takes the metaphor further: once CTRs and platform dashboards exist, they start dictating the questions we ask and the answers we accept. If it can’t be measured by the platform, it starts to look irrelevant; if it can, it begins to feel like truth. That’s how brands disappear into the machine and teams end up building compliance with an algorithm, not desire for their brand.
In B2B Tech marketing, this infection is everywhere – especially on LinkedIn. The platform vernacular nudges us to spend more to get more impressions, more engagement rate, more clicks, more “benchmarks.” Sure, LinkedIn analytics track impressions, engagement and CTR (and dozens of other shiny numbers), but none of these, on their own, prove marketing effectiveness. They prove the platform can count.
How many times have you got an email or a phone call from your ‘LinkedIn Ads rep’ based out of LinkedIn Marketing Solutions, saying that you need to spend more money on LinkedIn Ads? Brilliant. What a hot take. Spend more money on your media and get more clicks!? Wow – incredible. Shame it’s not the thing we should be looking at.
It’s time to trade the dashboard dopamine for metrics that actually build brands and pipelines. Below is the reset I recommend, anchored in the work of Les Binet, Dr Grace Kite, Jenni Romaniuk and Mark Ritson.
First, Diagnose the Infection
- Platform metrics ≠ brand metrics. Engagement rates by industry and impressions‑based formulas can be useful for channel health diagnostics, but they are not proxies for growth. Chasing higher engagement or more impressions is how you end up optimising feed compliance, not market penetration.
- LinkedIn’s own analytics vocabulary is inherently platform‑centric. It emphasises surface interactions – likes, comments, shares, clicks – without telling you whether mental availability improved, whether more of your category now remembers you, or whether your ESOV is sufficient to drive future market share gains.
What to Measure Instead (and Why)
1) Attentive Impressions & Attention Time (not raw impressions)
Not every impression counts, because many are ignored moments. Start tracking attentive reach (the number of people who actually looked) and aggregate attention time (how long, across exposures). Large‑scale research from Havas, Lumen and Brand Metrics shows attention time is closely correlated with brand outcomes, and that aggregate attention – built via frequency of consistent creative – drives brand awareness, consideration and preference.
Grace Kite’s analysis adds a practical twist for today’s fragmented media reality: “lots of little bits of attention” can add up. You can achieve brand lifts with multiple short exposures (e.g. 1–2 seconds each) so long as frequency and omnichannel coordination are strong. That means the goal isn’t a single, hero impression; it’s cumulative attentive time across the right audience.
What to track…
Attentive reach, average attention time per exposure, aggregate attention time per person, and frequency to attentive exposure. Where attention vendors aren’t available, track consumption proxies: content dwell ≥15s, % video views ≥25/50/95%, document completion rates, and on‑page scroll + time on page – but keep the focus on attentiveness, not raw delivery. (These proxies should be used as interim signals until you can integrate attention measurement.)
2) Mental Availability & Distinctive Brand Assets
Jenni Romaniuk’s work at Ehrenberg‑Bass makes this plain: brands grow by increasing mental availability (being easy to think of in buying situations) and by building distinctive assets that speed-up recognition and aid recall. B2B Tech marketers must measure whether your brand comes to mind across more Category Entry Points (CEPs), and whether your codes – logo, colours, typeface, sonic/audio assets – are actually owned and recognised.
What to track…
- Mental Availability metrics (prompted & unprompted brand salience across priority CEPs)
- Distinctive Asset Grid scores (asset fame and uniqueness over time)
- Profile/brand code recognition in ad tests (pre/post – does your creative make the brand easy to identify without a logo?)
3) Balance Long vs Short: ESOV, Share of Search & Econometric ROI
Les Binet & Peter Field’s evidence base shows growth comes from balancing brand building (lasting) and activation (short-term). A practical budgeting measure is Excess Share of Voice (ESOV): when your share of voice exceeds your share of market, you create the conditions for future growth. Mark Ritson reinforces this and proposes Share of Search (SoS) as a modern, accessible proxy for demand that can guide investment where SOV is hard to calculate. I would suggest that B2B Tech brands combine Share of Search and Share of Social to get a fuller digital picture.
What to track…
- ESOV (by category, quarterly)
- Share of Search, Share of Social (brand query share vs. main competitors)
- Econometric ROI (channel & creative contributions to sales and profit over time, not just last‑click ROAS). When possible, run MMM to apportion long‑term effects and synergy across media
4) Creative Effectiveness over Time
Effectiveness isn’t just what you run; it’s how long you let great work compound and how its positively effecting your buyers and growth. Ritson cites database fusion work showing a significant profit multiplier from running distinctive, emotional ads for longer (months to years), not constantly resetting creative to chase freshness for the algorithm. “Change less. Make fewer ads. Run them longer.” In B2B, this is a sanity saver: let codes bed in, then harvest the returns. And it’s another time when ad platforms are sending us in the wrong direction!
LinkedIn Ads: “You should be regularly changing your LinkedIn ad creative and messaging to improve your results.”
Meta Ads: “You should regularly change your creative and messaging on Meta Ads. There’s an average 60% drop in conversion after four exposures for ‘performance’ ads.”
Taboola: “You should run 8 ads per campaign for it to be effective.”
Google Ads: “You should change your Google Ads creatives every two weeks for high-spend campaigns and every four-weeks for low-spend campaigns.”
They all tell you to regularly change your ad creative and content, despite data showing us creative consistency and regular frequency are how to build mental availability.
Ignore what platforms say about constantly refreshing your creative and track…
- Emotion scores (pre‑test)
- Brand code presence (count of assets embedded in each execution)
- Wear‑in vs wear‑out curves (performance uplift with flight duration). Tie these to attentive time & mental availability improvements, not weekly CTR blips
How This Plays on LinkedIn (and Other Digital Channels)
LinkedIn is brilliant for B2B reach, but its default metrics bias marketers to celebrate impressions and engagement rate. Those are channel health indicators, not effectiveness KPIs. Use them to diagnose delivery issues (e.g. CPM spikes, CTR drops) but judge success on whether the right buyers gave you their attention long enough to consume and remember – and whether you’re accumulating aggregate attention across multiple touches, not just hitting an arbitrary engagement threshold.
On‑platform reset:
- Optimise toward attentive time per user using video completion, document read time, and dwell thresholds (e.g. ≥15s)
- Report attentive frequency (how many attentive exposures per target contact per month)
- Connect LinkedIn activity to Share of Search and wider Share of Social (a.k.a. did branded search rise in the regions/accounts you targeted?) and to mental availability shifts in brand tracking
A Simple, Practical Scorecard (for B2B Tech)
I would suggest that B2B Tech marketers focus in their measurement to lasting, impactful Brand Effects…
- Mental Availability (salience across 5–7 priority CEPs)
- Distinctive Asset Strength (fame + uniqueness trend)
- Share of Search/Social (monthly trend vs competitors)
- Aggregate Attention Time (per target, across channels)
Beware the “Spend More, Get More” Trap
Platform benchmarks often imply that more budget will improve impressions and engagement. Well, yes – if you spend more, you can buy more impressions. But effectiveness depends on who noticed, how long, how often, and what they remember. If the extra spend doesn’t increase attentive time, mental availability, ESOV, or Share of Search/Social, you’re feeding the parasite, not the brand.
Fishburne quoted William Bruce Cameron: “Not everything that counts can be counted, and not everything that can be counted counts.” In 2026, that’s not an excuse for being fuzzy; it’s a directive to count the right things. Let platforms do what platforms do. You – the B2B Tech marketer – should own the metrics that build brands, create demand, and compound value over time.