
Michael Curran
B2B Technology Buyer Personas for Multi-Person Decisions
B2B technology buyer personas should explain how people influence a shared decision. A useful persona…

B2B technology marketing benchmarks are useful when they help a team choose an action. A number needs a defined metric, a comparable peer group, a relevant time period and an explanation of what could cause the difference. Without that context, an industry average can make good performance look weak and weak performance look acceptable.
The demand for a single answer is understandable. Leaders want to know whether cost per lead, conversion, budget, pipeline contribution or paid-media performance is “good”. The difficulty is that technology markets vary by business model, deal size, sales cycle, category maturity, region, audience and measurement method. The same figure can carry a different meaning in an enterprise platform sale and a self-serve software model.
The practical response is not to reject benchmarks. It is to use a hierarchy that separates delivery health, buyer progress and commercial outcomes, then select comparisons that fit the decision.
Before looking for a benchmark, state what decision the number will inform.
Examples include:
The decision determines the metric and comparison. If the question is whether LinkedIn creative is earning attention, impressions, frequency and response may help. If the question is whether the programme produces valuable growth, those numbers are insufficient.
Write the metric as a full sentence. “Cost per qualified opportunity created from target accounts in the UK enterprise segment during Q2” is harder to misunderstand than “CPO”.
The ladder moves from controllable delivery measures to commercial outcomes. Each level needs the one below it for diagnosis, but leadership should not confuse lower-level efficiency with the final result.
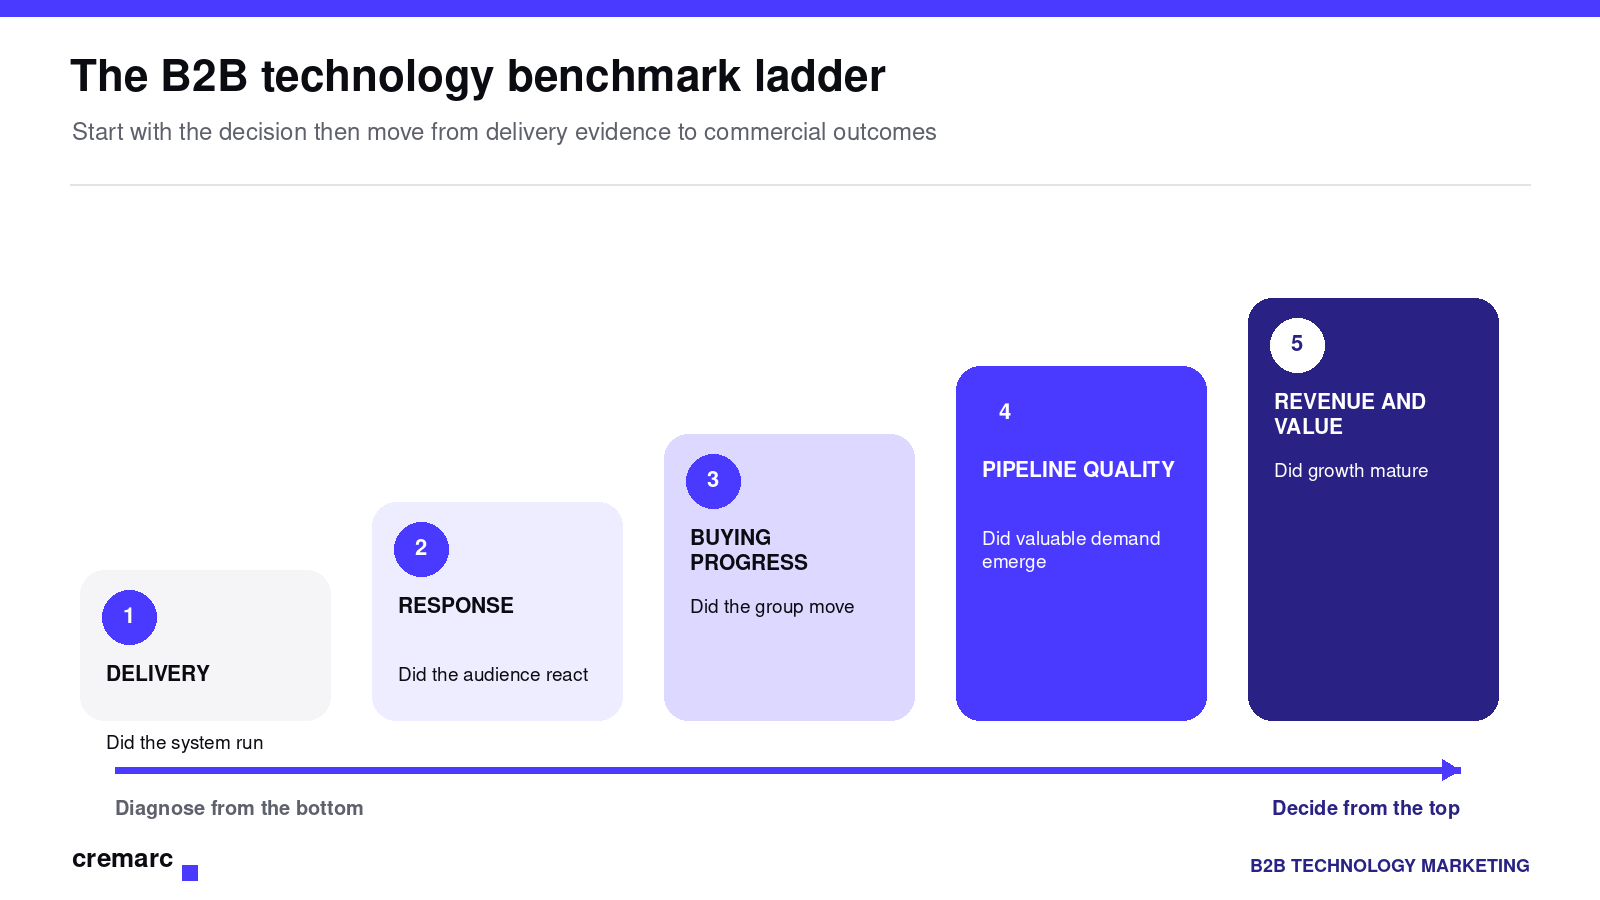
The B2B technology benchmark ladder
These measures show whether the marketing system delivered what was planned. Examples include spend, reach, frequency, viewability, deliverability, page speed, tracking coverage, content production and campaign launch accuracy.
Delivery benchmarks are useful for spotting technical or operational failure. They do not show whether the market cared.
Response measures include click-through rate, engagement, search behaviour, content use, landing-page action and event participation. They help compare messages, creative and experiences under similar conditions.
Response depends heavily on audience, placement and objective. An awareness campaign designed for broad reach should not be judged by the click rate expected from branded search.
These measures show whether relevant accounts and people are completing more of the decision. Examples include target-account engagement, buying-group coverage, repeat research, consumption of proof, stakeholder additions, sales acceptance, mutual action plans and stage velocity.
This level is particularly important in complex B2B technology. It provides evidence between a media interaction and an opportunity.
Pipeline measures include qualified opportunities, value, stage progression, no-decision rate, source and influence, sales cycle, win rate and reasons for loss. Define qualification and attribution carefully so comparisons remain stable.
Pipeline volume can rise while quality falls. Pair value with acceptance, progression and eventual outcomes.
The top level covers new revenue, gross margin, acquisition cost, payback, retention, expansion and customer lifetime value. These outcomes matter most, but they mature slowly and depend on sales, product, pricing, delivery and market conditions as well as marketing.
Use the ladder to diagnose a gap. If revenue is weak, find where the chain first breaks rather than jumping to the fastest available metric.
A credible benchmark states who is being compared. Consider at least seven dimensions.
Subscription, licence, services, hardware, usage and marketplace models produce different economics and buying behaviour.
Higher values normally involve more stakeholders, evidence and time. Lead and opportunity costs cannot be compared fairly across very different contract sizes.
Short-cycle activity can generate revenue evidence quickly. Enterprise programmes may need account and buying-progress indicators for several quarters.
Known categories benefit from existing demand and language. New or reframed categories require more education and memory building.
A campaign addressing 500 strategic accounts should judge reach and coverage differently from one addressing 100,000 small businesses.
Audience cost, regulation, language, competition and channel use vary by region.
Brand, demand capture, account progression and conversion activity should not share one response benchmark.
When a source does not disclose these dimensions, treat its number as a loose reference rather than a performance standard.
These three numbers have different jobs.
The baseline is your current or recent performance, using a stable definition. It tells you where the system starts and reveals normal variation.
The benchmark is an external or internal comparison. It can expose a gap or challenge an assumption. It does not automatically become the target.
The target is the performance required or realistically expected under the plan. It should reflect market potential, investment, constraints and the specific improvement being made.
Suppose an external source reports a landing-page conversion rate of 4 per cent. Your current rate is 2 per cent, but the audience is narrow and the action is a high-commitment consultation. The target might be 2.8 per cent after proposition and experience changes, while opportunity quality remains stable. Choosing 4 per cent because it is “the benchmark” can encourage lower-friction forms that increase volume and weaken intent.
For every important metric, create a short definition card.
| Field | Example question |
|---|---|
| Metric | What exactly is being measured |
| Formula | What are the numerator and denominator |
| Population | Which accounts people channels or opportunities are included |
| Period | When did the activity and outcome occur |
| Source | Which system or research produced the value |
| Comparison | Which baseline peer group or target is relevant |
| Drivers | What factors could reasonably change the result |
| Decision | What action will the team consider at each threshold |
This prevents two dashboards from using the same label for different calculations. It also makes AI-generated and third-party benchmark content easier to check.
External sources are valuable when their method and population are visible.
Gartner’s 2026 CMO Spend Survey, for example, reported an average marketing budget of 7.8 per cent of company revenue. That finding shows continued pressure on CMO resources. It should not decide an individual technology company’s budget without considering growth ambition, existing capability and commercial model.
The 6sense 2025 Buyer Experience research offers a different kind of benchmark. It reports how buying groups research, shortlist and engage suppliers. The metrics dashboard also allows filtered views, with a warning that small samples become less stable. That methodological note is as useful as the number because it tells readers how much confidence to place in a narrow comparison.
Prefer sources that provide sample, dates, definitions, geography and method. Avoid benchmark roundups that cite another roundup without reaching the original research.
Your own history is often the most comparable evidence available. Build a benchmark library across campaigns, segments, stages and time.
Agree what counts as a target account, engaged account, qualified enquiry, accepted opportunity, influenced pipeline and marketing-sourced revenue. Version definitions when they change.
Record audience, objective, offer, creative, channel, spend, duration, sales follow-up and market conditions. A number without context is difficult to reuse.
Report medians and ranges rather than one average where sample sizes allow. Outliers can distort B2B results, especially when a small number of large deals is involved.
Create cohorts by segment, deal value, campaign job and stage. A narrow target-account programme should be compared with similar programmes before it is compared with generic paid media.
Include sales acceptance, objection themes, call insight, content usefulness and loss reasons. Numbers can show where performance changed; qualitative evidence helps explain why.
Measure priority-audience reach, frequency, distinctive asset recognition, branded search, direct traffic, share of search where appropriate and association with buying situations. Short-term lead metrics will undervalue this work.
Measure coverage of relevant demand, qualified visits, search impression share, high-intent conversion, enquiry quality and opportunity creation. Separate branded and non-branded behaviour.
Measure account reach, buying-group coverage, engagement across roles, depth of proof consumption, sales interaction and opportunity movement. Avoid turning one active contact into an account-level conclusion.
Measure journey completion, form quality, demo progression, sales response, acceptance, stage conversion and reasons for abandonment. A higher form conversion is not automatically better if qualification falls.
Measure adoption, advocacy, retention, expansion, reference participation and customer value. Connect the measures to specific programmes rather than assigning all customer movement to marketing.
When performance sits above or below a benchmark, investigate the cause.
Ask:
Then choose the action. A low click rate may require new creative, but it may also reflect an awareness objective or narrow senior audience. A high cost per lead may be acceptable if opportunity value and progression are stronger.
Benchmark theatre occurs when numbers create the appearance of control without improving decisions.
Common signs include:
Replace the colour coding with a short interpretation: what changed, what is likely to explain it, what evidence is missing and what decision follows.
Run a structured review once the data for the period is sufficiently mature.
This sequence keeps the meeting focused on causes and choices rather than reporting every available number.
The most useful benchmarks connect delivery, audience response, buying progress, pipeline quality and revenue for a comparable market and objective. No single metric is sufficient.
It depends on the action, audience, source, proposition, deal value and qualification standard. Use your current cohort baseline and a genuinely comparable external source before setting a target.
Yes as context, not as automatic targets. Check the sample, definitions, period and business model, then explain how your situation differs.
Show counts alongside percentages, use longer periods or relevant cohorts, report ranges and combine quantitative patterns with buyer and sales evidence. Avoid strong conclusions from a few events.
B2B technology marketing benchmarks should sharpen judgement. They help leaders see whether the system is delivering, whether buyers are progressing and where commercial performance diverges from the plan. Their value comes from comparability and interpretation, not from the authority of an industry average.
Cremarc connects marketing data, revenue modelling, strategy, digital activity and buyer evidence for B2B technology companies. Talk to us about building a measurement framework that shows what is working, what is limiting growth and where investment should move next.