
Matt Berry
B2B PPC Budget Planning for Long Sales Cycles
B2B PPC budget planning should answer a commercial question, not simply choose a comfortable monthly…

B2B PPC benchmarks can be useful, but the familiar table of average click-through rates, costs per click and conversion rates often creates more confidence than insight. A software brand bidding on its own name in the UK is not comparable with a cybersecurity consultancy buying non-brand searches in North America. A LinkedIn lead-generation form is not the same outcome as a sales-accepted opportunity.
The purpose of a benchmark is to make an abnormal result visible and prompt a better question. It is not to declare performance good or bad without context. The strongest benchmark programme compares like with like, uses internal history before external averages and follows the measurement chain from media efficiency to qualified pipeline.
This guide sets out a practical benchmark framework for B2B technology teams that want decisions, not another collection of decontextualised averages.
Most benchmark reports aggregate many advertisers. Even where results are split by industry, the businesses inside one category can differ substantially in proposition, geography, brand maturity, deal size, audience and conversion definition.
Three accounts can report a 4 per cent conversion rate while measuring different events:
The percentages look comparable. Their commercial meaning is not.
Auction metrics also depend on market conditions. Cost per click reflects competition, quality, query mix, device, location, time and bid strategy. A higher CPC may be entirely rational when it buys access to a rare, valuable buying situation. A low CPC can be waste if it comes from broad informational traffic with no credible route to pipeline.
Start every comparison by asking what population, event and period produced the number.
Not every benchmark deserves the same weight. Use evidence in this order where possible.
The strongest reference is often your own history for the same market, proposition, intent group and conversion definition. Compare equivalent periods and account for major changes in tracking, consent, landing pages, bidding and sales process.
When a campaign is new, use another business unit, product or geography only if the buying economics are genuinely similar. Record the differences rather than silently treating it as a direct comparison.
Google Ads and LinkedIn can indicate auction conditions, audience size and expected delivery. These are useful for planning and investigation, but they describe platform behaviour rather than your complete commercial outcome.
Industry studies can provide broad orientation and help challenge an implausible result. Use the publication date, sample, geography, channel and conversion definition. A median is usually more informative than a mean when a small number of extreme accounts distort the distribution.
Treat case studies and peer comments as hypotheses. They can reveal an approach worth testing, but rarely provide the comparable denominator needed for a performance standard.
Every metric used in a performance comparison should carry a short context record. This prevents a number from being separated from the conditions that produced it.
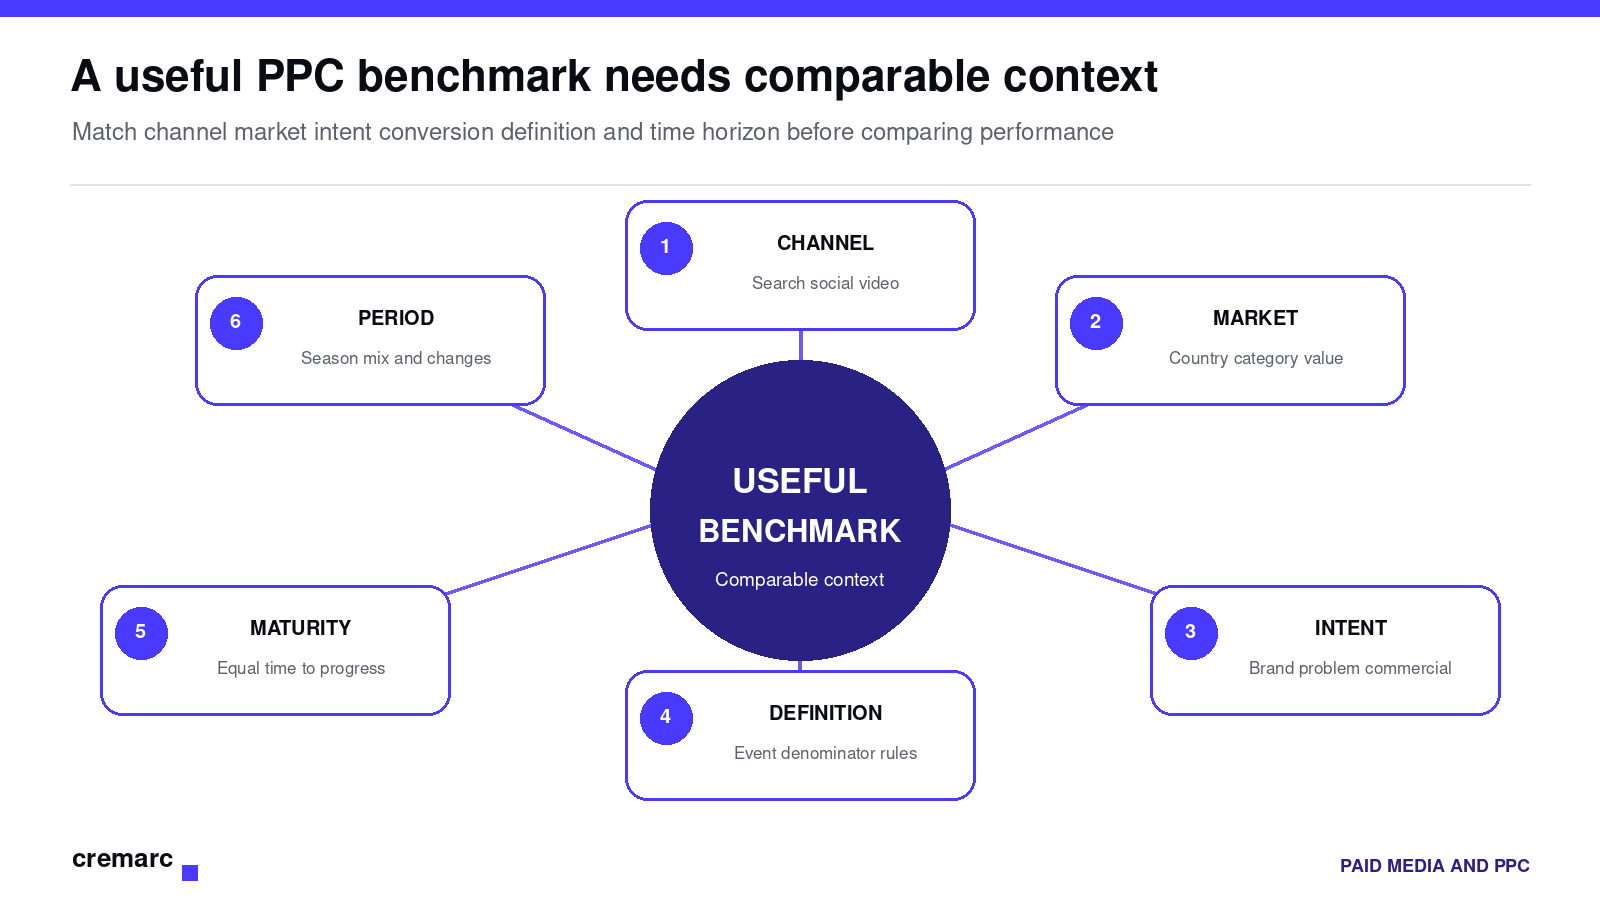
A useful PPC benchmark needs comparable context
Record at least:
A benchmark passport turns “our conversion rate is below average” into a specific statement such as: “Non-brand UK search for the infrastructure proposition converted clicks to qualified enquiries at 1.8 per cent over the last two quarters, using imported sales acceptance and a 90-day maturity window.” That statement can be investigated.
Do not expect one metric to represent the whole system. Use layers that diagnose different questions.
| Layer | Example metrics | Question answered |
|---|---|---|
| Auction access | Eligible impressions impression share lost share | Are we present in the auctions that matter |
| Attention | Click-through rate video completion engagement rate | Does the message earn relevant attention |
| Traffic economics | CPC CPM cost per engaged visit | What does access and attention cost |
| Website conversion | Landing-page conversion form completion | Can the experience convert intended visitors |
| Qualification | Relevant enquiry rate MQL rate sales acceptance | Are conversions commercially suitable |
| Pipeline | Opportunity rate pipeline value cost per opportunity | Does demand become credible revenue potential |
| Revenue | Win rate revenue payback contribution margin | Does the investment create commercial value |
This structure stops an attractive top-of-funnel result from masking a weak downstream outcome. A campaign may beat the click-through benchmark because an expansive message attracts curiosity. If qualification collapses, it has not improved performance.
Blended account metrics can move because the mix changed, even when each underlying campaign remained stable.
Suppose last quarter was dominated by brand search and this quarter includes more commercial non-brand activity. CPC may increase, click-through rate may fall and conversion rate may decline. That does not automatically mean execution worsened. The programme is doing a harder job.
Segment by variables that change the economics:
Avoid segmenting until every cell contains too little data to interpret. The goal is to isolate meaningful differences, not create a dashboard of noise.
A single “average” becomes a target whether or not anyone intended it. Use ranges, quartiles or bands instead.
For example:
An unusually high conversion rate may indicate excellent relevance. It can also mean the campaign is dominated by brand traffic, counts weak events or is under-delivering into a narrow remarketing audience. An unusually low cost per lead may be equally suspicious if qualification or opportunity creation deteriorates.
Show volume beside rates. A 50 per cent opportunity rate from two enquiries is not stronger evidence than a 24 per cent rate from 200. Where volume is low, widen the period, combine genuinely comparable cohorts or report the uncertainty.
Many benchmark disputes are denominator disputes.
Click-through rate can use impressions or viewable impressions. Conversion rate can use clicks, sessions, users or engaged visits. Cost per opportunity can include only media spend or media, creative, technology and agency costs. Pipeline return can use created pipeline, influenced pipeline or weighted pipeline.
Write the formula beside the metric. Examples include:
Keep created and influenced outcomes separate. Both can be useful, but they do not answer the same question.
B2B outcomes take time. If the current quarter has had 30 days to mature and the benchmark cohort had 180 days, opportunity and revenue comparisons will be structurally unfair.
Use cohort reporting. Group enquiries by the month or quarter they were created, then compare stage progression after equivalent elapsed time. For example, compare opportunity creation within 90 days for each cohort rather than comparing today’s total pipeline.
This also exposes changes in sales follow-up. If click and enquiry quality remain stable but opportunity creation slows, the issue may sit in routing, response time, discovery capacity or CRM updates rather than media.
A benchmark describes observed performance. A threshold defines what the business requires.
The market might commonly pay £180 per lead, but your economics may only support £120. Conversely, a £300 qualified enquiry may be attractive when opportunity values and win rates are high.
Use three reference points:
When these conflict, the commercial requirement should guide the decision. External averages cannot make unprofitable economics acceptable.
If performance differs from the reference range, identify the likely layer before changing bids.
A low click-through rate can reflect weak copy, poor position, broad queries or low brand familiarity. A low landing-page conversion rate can reflect message mismatch, friction, irrelevant traffic or a conversion request that is too large for the buying stage. A low qualification rate often points to query intent, audience criteria, proposition clarity or form design. A low opportunity rate may reveal sales response, routing or inconsistent acceptance criteria.
Use the benchmark to choose the investigation. Do not optimise the visible metric in isolation. Increasing click-through rate with a broader promise can damage lead quality; shortening a form can increase submissions while reducing the evidence sales needs.
Use different cadences for different evidence.
Annotate material changes such as a consent update, landing-page launch, CRM migration, bid-strategy change or product release. A benchmark series without change history can make technical disruption look like market movement.
Benchmark definitions drift when nobody owns them. Marketing may change a conversion event, sales may tighten acceptance, or finance may revise the revenue field while the dashboard continues to show an apparently continuous trend.
Assign an owner to each commercial definition and record the date on which the reference range was last validated. Set an expiry or review trigger for benchmarks affected by market conditions, such as CPC, CPM and impression share. More stable measures, such as a qualification rule, still need review when the proposition or sales process changes.
Keep previous benchmark versions. When a definition changes, do not silently restate the past unless the underlying data can be rebuilt consistently. Mark the break in the series and explain what remains comparable. This preserves trust and prevents a process improvement from appearing as an unexplained performance decline.
Avoid these patterns:
The practical test is whether the comparison leads to a better decision. If it cannot tell the team what to investigate, protect, stop or test, it is only decoration.
There is no universal rate. It depends on channel, intent, market, proposition, landing page and what counts as a conversion. Use separate rates for captured enquiries, qualified enquiries and opportunities, then compare equivalent cohorts.
Use them as broad context, not a performance target. Check the sample, period, geography and conversion definition, and prioritise comparable internal evidence.
No. A lower cost can come from weaker intent or easier conversion events. Judge cost alongside qualification, opportunity creation, value and sales capacity.
There is no fixed number for every metric. Report volume and uncertainty, extend the period where the market is small and avoid strong conclusions from a handful of events.
Useful B2B PPC benchmarks preserve context. They compare the same job, market, intent, event and maturity window, then connect platform performance to qualified commercial outcomes.
Cremarc combines paid media delivery with data, buyer insight and revenue measurement for B2B technology brands. Book a paid media discovery to create a benchmark framework that helps your team diagnose performance rather than simply compare percentages.